

What I check before a number goes on a manufacturing dashboard
I’ll start with something that sounds harsh: most plant dashboards are too big. Not too ugly, not too slow. Too big. Somebody gets the job, somebody else has a list of “important” figures, and a few weeks later there are thirty tiles on the screen and nobody can tell you which ones matter.
Picture the shift supervisor on a normal morning. He has maybe five minutes before the line gets busy. If you ask him which three tiles he looks at and he can’t say, the dashboard failed, however good the Power BI work behind it was. (The scene is made up, but I’d bet you’ve seen a version of it.)
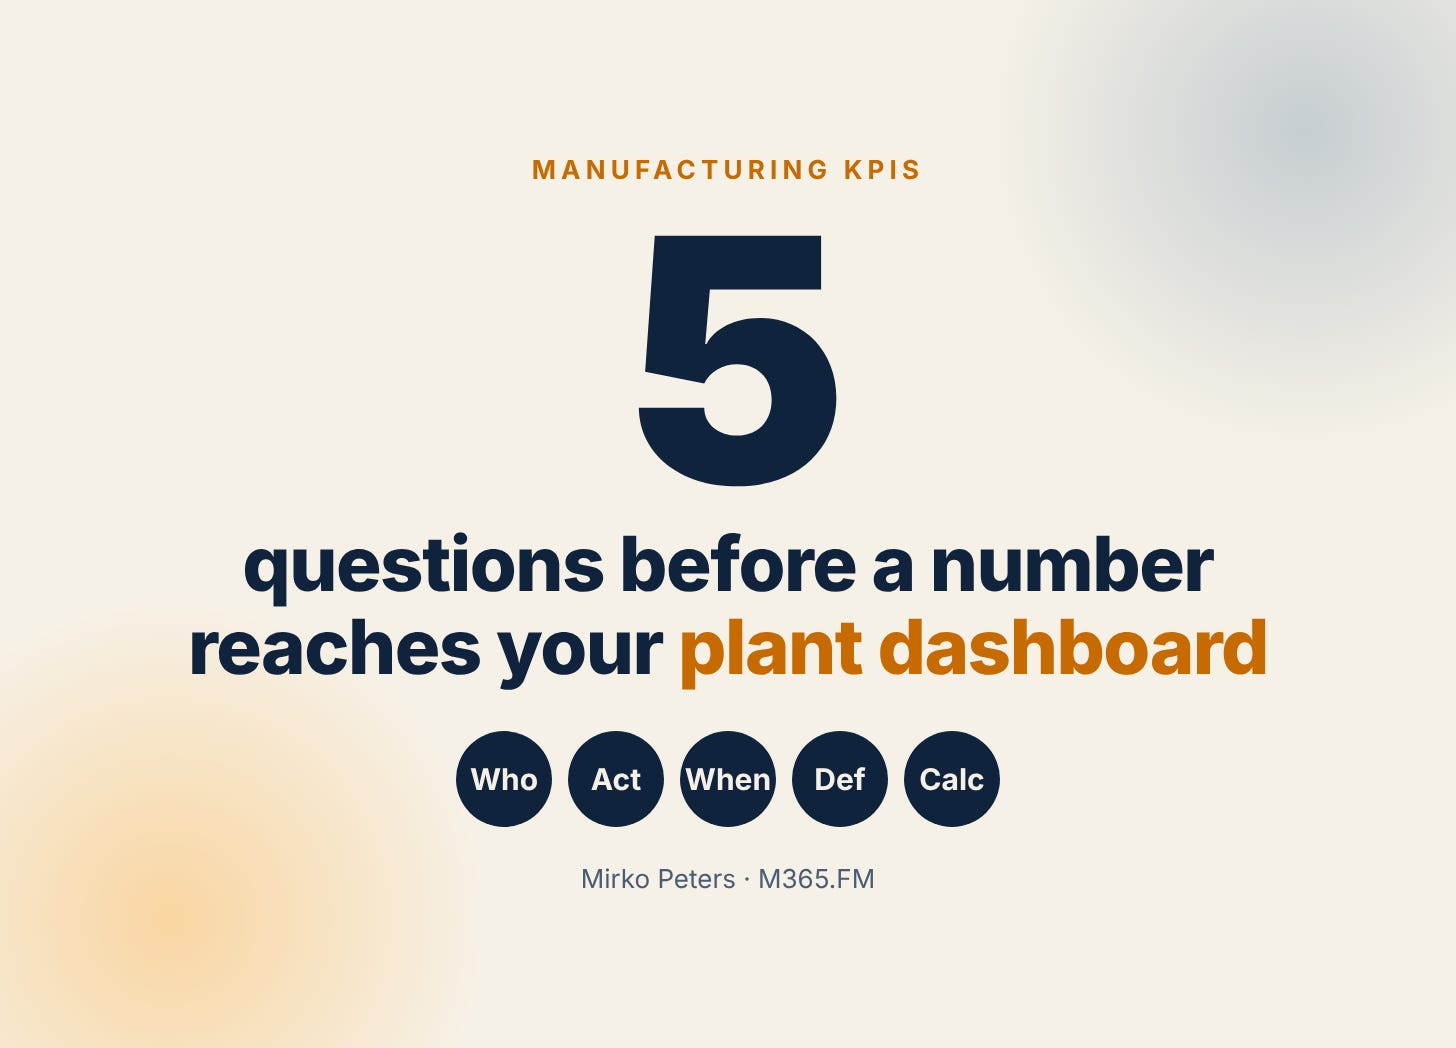
So before a number gets a spot, I ask it some questions. They’re not fancy. I just notice how often the answers are missing.
The first one is who actually looks at it. A name, or at least a job. “Production” isn’t an answer because production is two hundred people. The second is what that person does when the number turns red. If the answer is “well, we know anyway”, fine, but then it doesn’t need a tile. A key performance indicator without an owner and a reaction is just a number with a nice font.
Third, how quickly do they need to know? A stop at the bottleneck is a minutes thing. Scrap by month is a Monday meeting thing. That one question decides the refresh rate and where the tile sits, and it usually kills a few tiles right away.
Where the arguments start
The fourth question is the boring one and the most useful: is the definition written down? Take “on-time delivery”. One person measures it against the date the customer asked for. Another measures against the date you promised. Same name, different numbers, and now the dashboard is the start of a fight and not the end of one.
ISO 22400-1 helps a bit here. ISO describes it as an industry-neutral framework for defining, composing, exchanging and using KPIs in manufacturing operations management. I’m not saying certify anything. I’m saying copy the habit. One small card per KPI: what it’s for, the formula, where the data comes from, how often it refreshes, the unit, the target, the owner. Half a page. It saves a lot of meetings.
And then the math. The mistake I’d watch for first is averaging percentages. Say line 1 runs eight hours at 80% and line 2 runs two hours at 50%. The plain average gives you 65%. Weighted by planned time it’s (8 × 0.8 + 2 × 0.5) ÷ 10, which is 74%. Quite a gap, and the numbers are invented, but the effect is real. Add up the hours or the pieces first and calculate the percentage once at the end.
OEE gets this treatment a lot, so a quick side note. The OEE FAQ at oee.com describes it as availability times performance times quality. It also calls the famous 85% “world-class” number completely artificial as a universal benchmark. I take that seriously. OEE is good for watching one machine over time. For ranking plants against each other I’d be careful.
Smaller than you think
If I had to start from zero tomorrow, I wouldn’t build a plant dashboard. I’d take one line, one audience, and stop at six tiles. For a supervisor that might be output against plan per hour, the current stops with reasons, scrap, and what’s next in the order list. Microsoft’s own tips for designing Power BI dashboards say something similar. Think about how people really use it, put the most important number top left, and use fewer tiles for phones and tablets than for a big monitor.
After that, let the dashboard speak up. Power BI data alerts can notify you when a value crosses a threshold. A few limits worth knowing, per Microsoft Learn: they work on gauge, KPI and card tiles, only with numeric data, only after the data has refreshed, and they’re personal, so only the person who set an alert sees it. I’d keep it to two or three. With ten, everybody mutes them and you’re back where you started.
Then run it on one shift for a few weeks. Every week, take away whatever nobody opened. That last step feels wrong the first time, and it’s probably the most valuable one.
A disclosure, since I should
I work with iFAKT. If you want your KPIs to compare plan against actual, iFAKT Polaris is one option to look at. iFAKT describes it as AI plus a digital twin for production, and the Polaris Analyzer module pulls KPIs from the other Polaris modules into dashboards and compares scenarios, plans and actual performance. It fits best if you also plan or simulate in Polaris. If you just want a clean Power BI dashboard on your own data, everything above applies the same way.
One thing to try this week: pick the line you know best, write the card for its three most important KPIs, and write a name and a reaction next to each. Open Power BI after that. If you do it, reply and tell me which tile you deleted first. I’d like to know.
The longer version, with all sources, is here: Manufacturing KPI Dashboard: What to Show and How to Build It.
Sources: OEE FAQ (oee.com, Vorne Industries); ISO 22400-1:2014 (ISO); "Tips for designing a great Power BI dashboard" and "Data alerts in the Power BI service" (Microsoft Learn). The supervisor scene and the numbers in the examples are invented for illustration.
The weighted average point is the one I see broken most. 80% and 50% do not make 65%. I'd add one line to each KPI card: how the number is rolled up across shifts or lines. That alone stops a lot of arguments.